UI components and charts
Open alternatives4
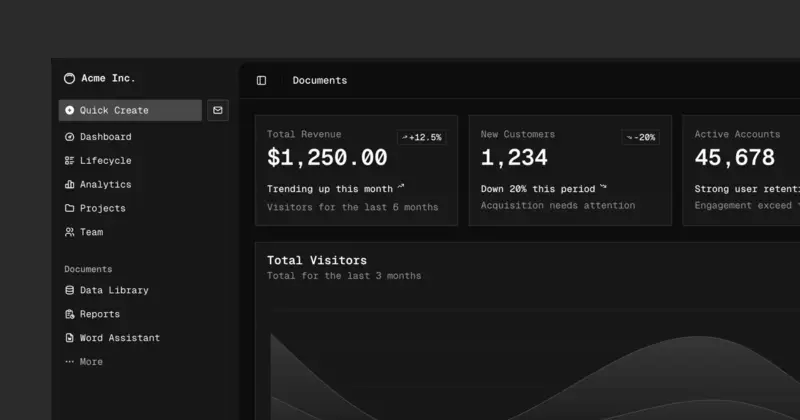
A collection of ready-made user interface pieces, such as buttons and menus, that people can copy into their own website or app and change as they like. It is aimed at programmers who build web applications.
Has 0 of 4
How many people bookmarked its code on GitHub. It shows how popular it is, not how good it is or how well it replaces the app.
How hard it is to start using it. Easy: install it like a normal app, or use it in your browser. Advanced: you run it on your own server, use the command line, or it is a tool for developers.
Its code changed within the last year, so someone is still looking after it.
Does part of the job.
Ordered by how fully it replaces the app, Verified, setup and, when there are enough, people's votes.
Chart.js is a free library that lets web developers draw charts such as line, bar and pie charts on web pages. It is for programmers building websites or apps who want to show data visually.
Has 1 of 4 · Spreadsheet-style tables ✗
How many people bookmarked its code on GitHub. It shows how popular it is, not how good it is or how well it replaces the app.
How hard it is to start using it. Easy: install it like a normal app, or use it in your browser. Advanced: you run it on your own server, use the command line, or it is a tool for developers.
Its code changed within the last year, so someone is still looking after it.
Does part of the job.
Ordered by how fully it replaces the app, Verified, setup and, when there are enough, people's votes.
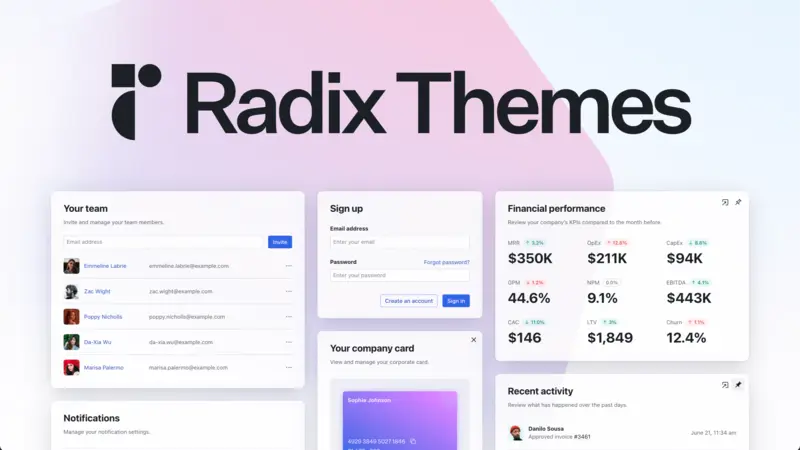
Radix Themes is a free, open-source set of ready-made parts for building websites and web apps, such as buttons and layouts. It is for programmers who want to build interfaces quickly and keep them accessible.
Has 0 of 4 · Charts included ✗ +1
How many people bookmarked its code on GitHub. It shows how popular it is, not how good it is or how well it replaces the app.
How hard it is to start using it. Easy: install it like a normal app, or use it in your browser. Advanced: you run it on your own server, use the command line, or it is a tool for developers.
Its code changed within the last year, so someone is still looking after it.
Does part of the job.
Ordered by how fully it replaces the app, Verified, setup and, when there are enough, people's votes.
Apache ECharts is a free library of code that lets programmers draw interactive charts and graphs for websites and apps. It is aimed at software developers who build products that show data.
Has 1 of 4
How many people bookmarked its code on GitHub. It shows how popular it is, not how good it is or how well it replaces the app.
How hard it is to start using it. Easy: install it like a normal app, or use it in your browser. Advanced: you run it on your own server, use the command line, or it is a tool for developers.
Its code changed within the last year, so someone is still looking after it.
Does part of the job.
Ordered by how fully it replaces the app, Verified, setup and, when there are enough, people's votes.
| Project | ||||
|---|---|---|---|---|
| shadcn/ui | · | · | · | |
| Chart.js | · | · | ||
| Radix UI | · | |||
| Apache ECharts | · | · |
YesPartlyNoNot checked yet