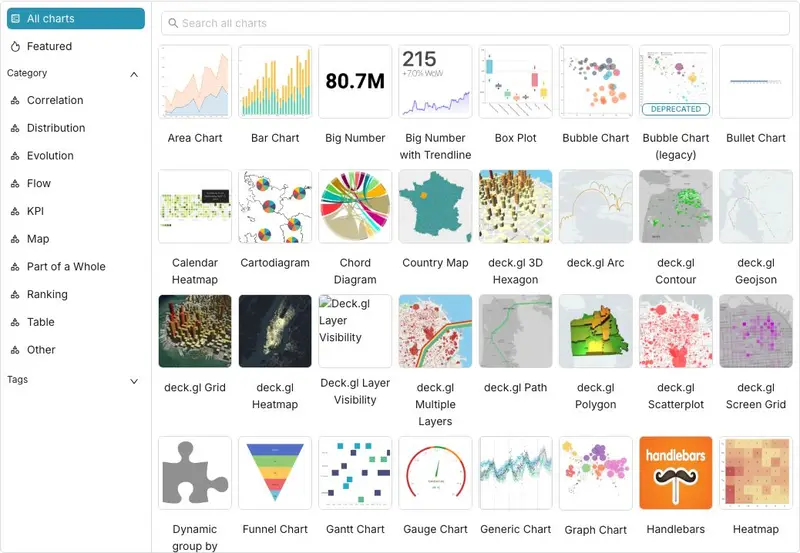
Superset is a web-based tool for exploring data, building charts and dashboards, and running SQL queries against many database types. It is aimed at analysts and business teams who want to understand their data.
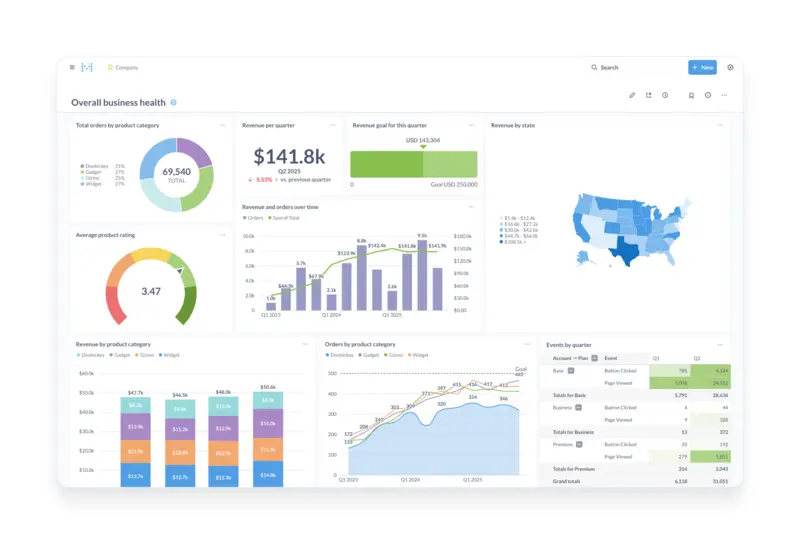
Metabase is a tool that lets people in a company ask questions of their data and see the answers as charts and dashboards. It is for teams of all sizes, including people who don't write SQL.
Evidence is a tool for building data reports by writing SQL queries and markdown text in code instead of dragging and dropping. It is aimed at analysts and developers who want reports they can version and publish.
6.2kActiveMac · LinuxMITOpen coreRuns on your own server
Lightdash is a business intelligence tool for building charts, dashboards and shared metric definitions on top of a company's data warehouse. It is for data teams and business users, and its open-source core can be self-hosted, while AI agents and some other features are aimed at the paid cloud and enterprise versions.
21kActiveWindows · Mac · LinuxApache-2.0Replaces partlyFor developers
Cube Core is a semantic layer that defines business metrics once and shares them through SQL, REST and GraphQL interfaces for reporting tools and apps. It is aimed at developers and data teams building their own analytics experiences, and it ships without a user interface.
626Quiet for a yearApache-2.0Replaces partlyRuns on your own server
Synmetrix (formerly MLCraft) is a self-hosted semantic layer that defines business metrics once so teams and BI tools read the same numbers. It is aimed at data teams and organizations that want a single source of truth for metrics.
330Quiet for a yearApache-2.0Replaces partlyFor developers
Metriql is a tool that lets a company define its business numbers, such as sales or revenue figures, once as code and share them across its reporting tools. It is aimed at data teams who build dashboards and reports.
For developers · GitHub
None of these match. Try another device.
Before you build
Planning something for an alternative to PowerBI? See what exists first, so you can reuse parts or explain what's different. Paste this into any AI assistant:
Read the list of open-source alternatives at https://opensourceeverything.org/data/groups/bi.json. Compare it with my project or idea below. Tell me which projects overlap, what I could reuse instead of rewriting, and what mine does that none of them do.
My project or idea:
Here is a list of open-source alternatives to PowerBI, from Open Source Everything (CC BY-SA 4.0):
- Preset (Apache-2.0, https://github.com/apache/superset; replaces fully): Superset is a web-based tool for exploring data, building charts and dashboards, and running SQL queries against many database types. It is aimed at analysts and business teams who want to understand their data.
- Metabase (AGPL-3.0, https://github.com/metabase/metabase; replaces fully): Metabase is a tool that lets people in a company ask questions of their data and see the answers as charts and dashboards. It is for teams of all sizes, including people who don't write SQL.
- Evidence (MIT, https://github.com/evidence-dev/evidence; replaces fully): Evidence is a tool for building data reports by writing SQL queries and markdown text in code instead of dragging and dropping. It is aimed at analysts and developers who want reports they can version and publish.
- LightDash (MIT, https://github.com/lightdash/lightdash; replaces fully): Lightdash is a business intelligence tool for building charts, dashboards and shared metric definitions on top of a company's data warehouse. It is for data teams and business users, and its open-source core can be self-hosted, while AI agents and some other features are aimed at the paid cloud and enterprise versions.
- Cube.js (Apache-2.0, https://github.com/cube-js/cube; replaces partly): Cube Core is a semantic layer that defines business metrics once and shares them through SQL, REST and GraphQL interfaces for reporting tools and apps. It is aimed at developers and data teams building their own analytics experiences, and it ships without a user interface.
- MLCraft (Apache-2.0, https://github.com/synmetrix/synmetrix; replaces partly): Synmetrix (formerly MLCraft) is a self-hosted semantic layer that defines business metrics once so teams and BI tools read the same numbers. It is aimed at data teams and organizations that want a single source of truth for metrics.
- MetriQL (Apache-2.0, https://github.com/metriql/metriql; replaces partly): Metriql is a tool that lets a company define its business numbers, such as sales or revenue figures, once as code and share them across its reporting tools. It is aimed at data teams who build dashboards and reports.
Compare it with my project or idea below. Tell me which projects overlap, what I could reuse instead of rewriting, and what mine does that none of them do.
My project or idea: